Line Logic: Turning CES 2027 Demo Waits Into a US Retail Readiness Checklist
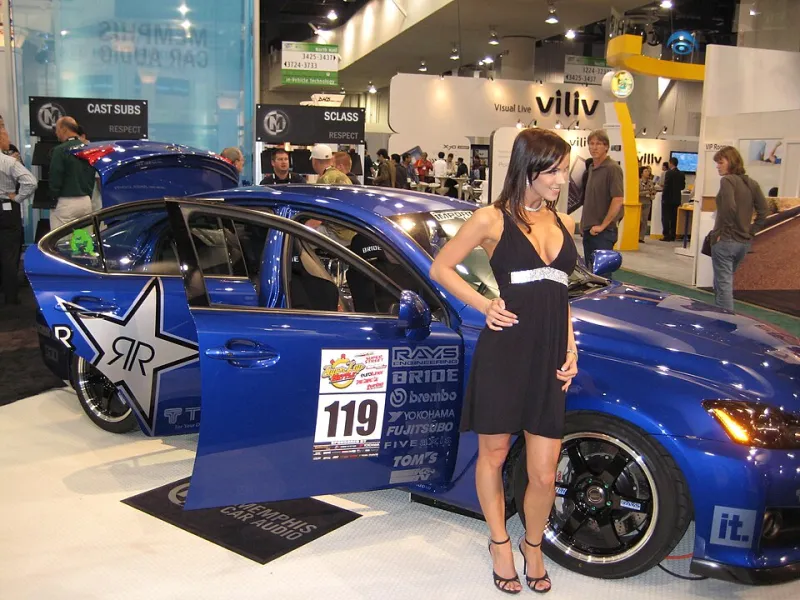
Photo: Intel Free Press, CC BY 2.0, via Wikimedia Commons
CES 2027 will produce thousands of impressions, but one of the most useful datasets will be informal and easy to miss: the behavior of people waiting to see a product. Demo lines are not a scientific sample. They are still a signal. For US retail buyers and early adopters, the shape of a line, the rate at which it moves, and the reasons people leave it can help separate durable interest from stagecraft before a product reaches American preorder pages and store shelves.
FutureXpo treats the show floor as an observation environment, not a scoreboard. The goal is not to declare a winner from a Las Vegas Convention Center aisle. The goal is to ask better questions before a CES 2027 demo turns into a 2027 retail commitment.
Why a Wait Time Is a Data Point
A posted wait time is only the beginning. The more useful measure is how long attendees actually stand in line before they reach a hands-on station. A 20-minute queue that moves steadily tells a different story than a 20-minute queue that stalls because one demonstrator is managing a crowd of 30. Buyers should note the start time, the observed wait, and whether the line is moving at a consistent pace or in bursts.
Context matters. A short line at a small booth may reflect low awareness rather than low interest. A long line near a main entrance may reflect foot traffic rather than product pull. The practical approach is to sample the same booth at multiple times: early morning, midday, and late afternoon. If the wait remains meaningful across those windows, the product has at least sustained attention. If the line collapses after the first rush, the initial crowd may have been driven by a scheduled demo, a giveaway, or a celebrity appearance.
For US retail planning, the question is not whether a line was long. It is whether the line represented people who would consider a purchase. A buyer can begin by asking what attendees did after the demo. Did they linger to ask about pricing, compatibility, or availability? Did they scan a QR code for a US launch list? Did they return with a colleague? Those behaviors are closer to purchase intent than a passive wait.
Reading Abandonment Without Overreading It
Abandonment is the most overlooked line metric. Attendees leave queues for many reasons: a session starting elsewhere, a better offer across the hall, a lack of seating, unclear messaging, or a product that looks less compelling up close. An abandon rate is not automatically a negative verdict. It becomes useful when paired with observation of why people left.
A useful field note is the point of departure. If attendees leave in the first few minutes, the problem may be line management or unclear value. If they leave after seeing a demo from a distance, the issue may be perceived differentiation. If they leave only when staff announce a delay, the signal is operational. Buyers should distinguish between a product that failed to hold attention and a booth that failed to manage attention.
This distinction matters for US shelf readiness. A product that draws curiosity but loses people before hands-on time may still succeed with the right retail demonstration. A product that keeps people waiting but produces no post-demo questions may be benefiting from spectacle. The line is a filter, not a final answer.
Repeat Visitors and the Staff-to-Attendee Ratio
Repeat visitors are a stronger signal than first-time queue length. An attendee who returns to a booth, brings a colleague, or waits through a second demo is demonstrating sustained interest. At CES 2027, buyers should watch for recognizable faces, badge scanning patterns, and whether repeat visitors ask deeper questions about setup, subscription terms, repair options, or US carrier compatibility.
The staff-to-attendee ratio adds another layer. A booth with 12 demonstrators and a 15-minute wait may be well staffed. A booth with two demonstrators and the same wait may be creating artificial scarcity or simply under-resourced. Neither is inherently good or bad, but the ratio affects what the line means. If attendees cannot get a substantive answer because staff are managing crowd flow, the line is producing impressions rather than information.
For early adopters, the ratio also affects demo quality. A rushed hands-on session can hide usability problems. A well-staffed booth allows attendees to test the product in realistic conditions. US buyers should note whether staff can explain warranty terms, return policies, and retail availability without deferring to a website. Those answers are part of the product experience, not a separate marketing layer.
Spectacle Versus Intent
CES is designed to produce spectacle. Staged lighting, synchronized screens, and timed demonstrations can generate a crowd that looks like demand. The analytical task is to separate the attraction from the product. One approach is to observe the line before and after a scheduled moment. If the queue spikes only around a performance and disappears afterward, the product may be secondary to the show.
Another approach is to watch what attendees do with the product. Do they compare it to a device they already own? Do they ask about a US release date without prompting? Do they mention a specific retailer or preorder page? Do they take photos of the spec sheet rather than the stage? These small behaviors are more useful than a headline count of booth visitors.
A neutral reading is essential. A quiet booth may indicate a niche product with limited US appeal, or it may indicate a product that needs a different demonstration format. A crowded booth may indicate genuine demand, or it may indicate effective crowd capture. Buyers should record both the crowd and the conversation.
From Aisle to Shelf: Questions for Buyers
The line data becomes useful only when translated into preorder and shelf-readiness questions. Before CES 2027 closes, US buyers can ask: Did attendees understand the product without a scripted pitch? Did they ask about price in a way that suggests a real purchase window? Did repeat visitors include retail partners or industry users? Did the booth staff have clear answers on US availability, support, and returns?
Early adopters can ask a parallel set of questions: Was the demo repeatable outside a controlled setting? Did the product invite a second look after the first impression? Did the line experience create confidence or fatigue? Those answers can inform whether to join a preorder list, wait for independent reviews, or track the product through the next expo cycle.
A Practical Observation Sheet
A simple field sheet can make CES 2027 line observations more comparable across booths. Record the booth name, date, time, observed wait, line length, number of demonstrators, approximate abandon rate, and whether the line moves steadily or in bursts. Add a short note on post-demo behavior: questions asked, materials scanned, and whether attendees return. Keep the language factual and avoid ranking booths by crowd size alone.
The resulting dataset will not replace buyer judgment. It will, however, give US retail teams and early adopters a more disciplined way to read the show floor. At CES 2027, the line is not the forecast. It is a prompt for better questions before the product reaches an American checkout page.